
Your data is everywhere. We build the system that brings it together.
Novriq Labs designs and builds reliable data pipelines that connect your business platforms, centralize your data, and turn it into analytics your team can actually use.
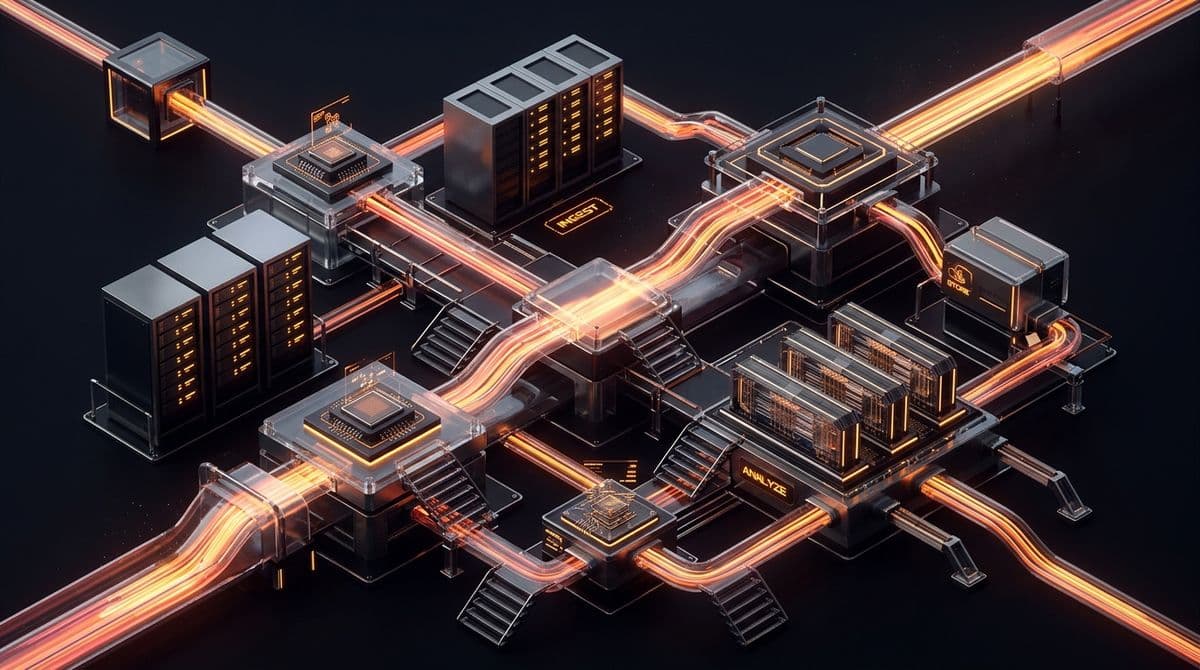
Seven-Platform API Collector

Centralized Extraction & Modeling
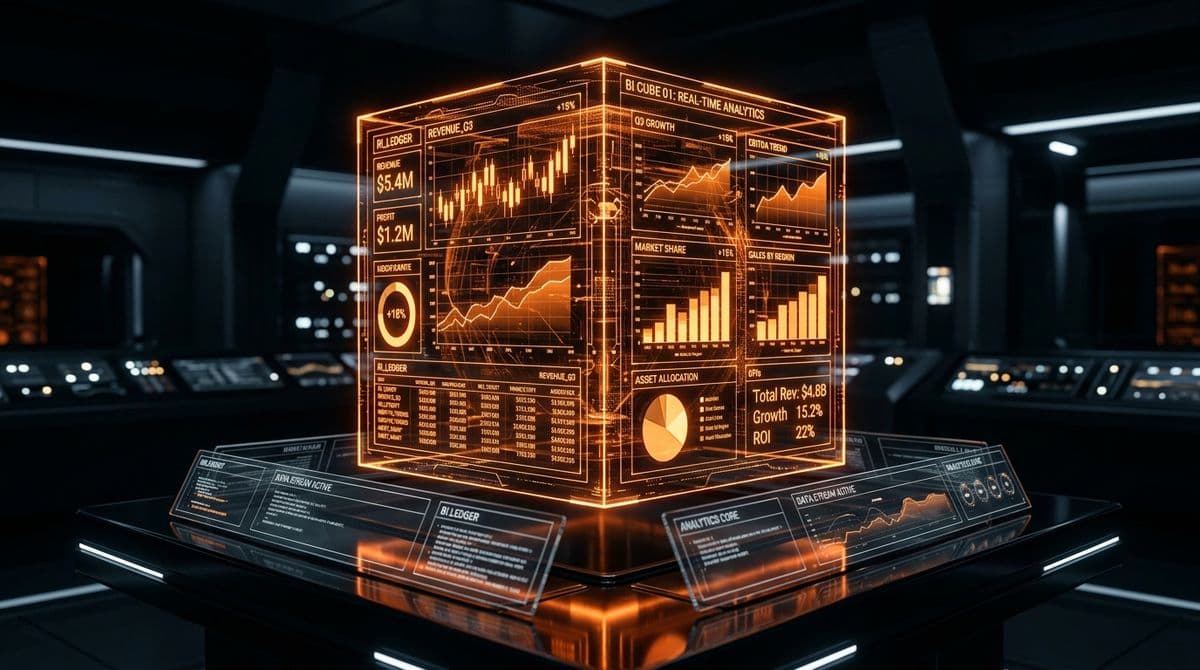
Unified Analytics & Dashboards
// INGESTION INVENTORY
From fragmented APIs to one reliable data layer.
Every platform holds one piece of the picture and none of them agree on dates, currencies, or what counts as a conversion. We connect to each on its own terms — auth, pagination, rate limits, schema drift — and land it somewhere the numbers can be reconciled.
Commerce
- Shopify
- E-commerce platforms
Advertising
- Google Ads
- Meta Ads
Analytics
- Google Analytics 4
CRM
- HubSpot
- CRM systems
Custom
- Internal APIs
- Partner endpoints
* Platform names describe what we integrate with. They are not customer or partner marks.
Explore all 50+ sources & protocolsSix stages, and the sixth is the only one anyone sees.
Connect, extract, transform, store, analyze, deliver. Most of the engineering happens in the first five, which is the part that decides whether the sixth can be trusted.
Connect APIs & Extract Structured Data
OAuth and key-based auth, rate-limit-aware clients, scheduled and incremental extraction with watermarks, pagination, and replay for any window that was missed.
Clean, Normalize, Validate & Store
Type coercion, deduplication, currency and timezone normalization, and referential checks that fail loudly. Landed into PostgreSQL, a cloud database, or a data warehouse.
Build Analytics Models & Business Dashboards
Conformed dimensions, agreed metric definitions, and tables shaped around the questions people keep asking. Delivered to Power BI, Tableau, or custom React dashboards.
Three layers. We build all of them, in that order.
Each layer depends on the one beneath it. Taking on the top without the ones below is how reporting ends up disagreeing with itself.
Data Engineering
The layer that has to run every day without supervision.
- API integrations
- ETL / ELT pipelines
- Data ingestion
- Data transformation
- Data modeling
- Database architecture
- Data warehouse solutions
- Pipeline monitoring
- Fault-tolerant pipelines
Analytics Engineering
The layer that decides what a number means.
- Data modeling
- Analytics-ready datasets
- KPI systems
- Reporting layers
- Business intelligence architecture
Dashboard Development
The layer everyone else actually looks at.
- Power BI
- Tableau
- React dashboards
- Custom analytics applications
- Interactive reporting systems
Reference stack, top to bottom. Five layers, every engagement.
A data stack built around your business — not around a template.
The same five layers every time. What changes is the shape of each one, and that is decided by your systems, your volumes, and the questions you need answered.
Data sources
Ingestion
Every scheduled run either passes, arrives late, or fails, and all three are handled. A late or failed window is retried and replayed. It is never silently skipped.
Data platform
Transformation
Analytics
// TYPICAL ENGAGEMENTS
Engagements, in the shape they usually take.
Illustrative engagements. These describe the kind of work Novriq Labs does, not delivered client projects, and they carry no client names, figures, or results. Replace them as real case studies become available.
E-commerce analytics pipeline
Data was fragmented across multiple commerce and advertising platforms, each with its own definition of a sale.
A centralized pipeline connecting Shopify, GA4 and the advertising APIs, with normalization and validation before anything reached the warehouse.
A unified analytics layer powering business dashboards from a single set of models.
Paid media reporting layer
Spend and performance lived in three ad platforms with different attribution windows and reporting lags.
Incremental extraction per platform with restatement handling, then a conformed model that expresses spend, delivery and conversion on one calendar.
One reporting layer that can be compared across channels without manual reconciliation.
CRM and revenue reconciliation
The CRM and the commerce platform disagreed on which customers and orders existed.
Identity resolution across systems, a reconciliation model that records disagreements rather than hiding them, and checks that surface breaks as they appear.
A revenue view whose differences are explainable instead of unexplained.
Phases overlap. The axis below is sequence, not a schedule; we do not quote a timeline before we have seen your systems.
How an engagement runs.
Six phases, and the last one does not end. A pipeline that nobody watches is a pipeline that quietly stops being true.
Discover
Understand systems, business requirements and reporting needs.
Architect
Design the data architecture and integration strategy.
Build
Implement pipelines, transformations and storage.
Validate
Test data quality, reliability and edge cases.
Deliver
Connect the analytics layer and dashboards.
Improve
Monitor, optimize and extend the system.
Architects of Scale & Performance.
Our founders bring decades of specialized experience across distributed systems, streaming engines, and product execution.

Muhammad Daniyal Khan
Guiding data pipeline strategy, platform architecture, and enterprise analytics infrastructure.

Alber Abbas
Architecting resilient ETL/ELT pipelines, API connector frameworks, and fault-tolerant data storage.

Mubeen Ilyas
Designing interactive reporting interfaces, analytics models, and seamless client data workflows.
Have data in five different places? Let us build one system around it.
Tell us what systems you use, what data you need, and what you want to see. We will help you design the pipeline behind it.
- The platforms you pull from, and which ones matter most
- Where the data needs to land, if that is already decided
- Who reads the reports, and what decision they make from them
- Anything that is already breaking